$2.2BIndia’s exports in 2025
80countries bought from India in 2025
0.9×change since 2013 ($2.4B)
$9.3BIndia also imported in 2025
India’s exports, year by year
US$, calendar years, all destinations combined. Source: UN Comtrade (India’s own reports).
Biggest buyers, 2025
- China
- Malaysia
- Bangladesh
- Indonesia
- Philippines
- Rep. of Korea
- Viet Nam
- Saudi Arabia
- Nepal
- Japan
Ranked by value. Country-by-country figures are not shown.
Headings in this chapter
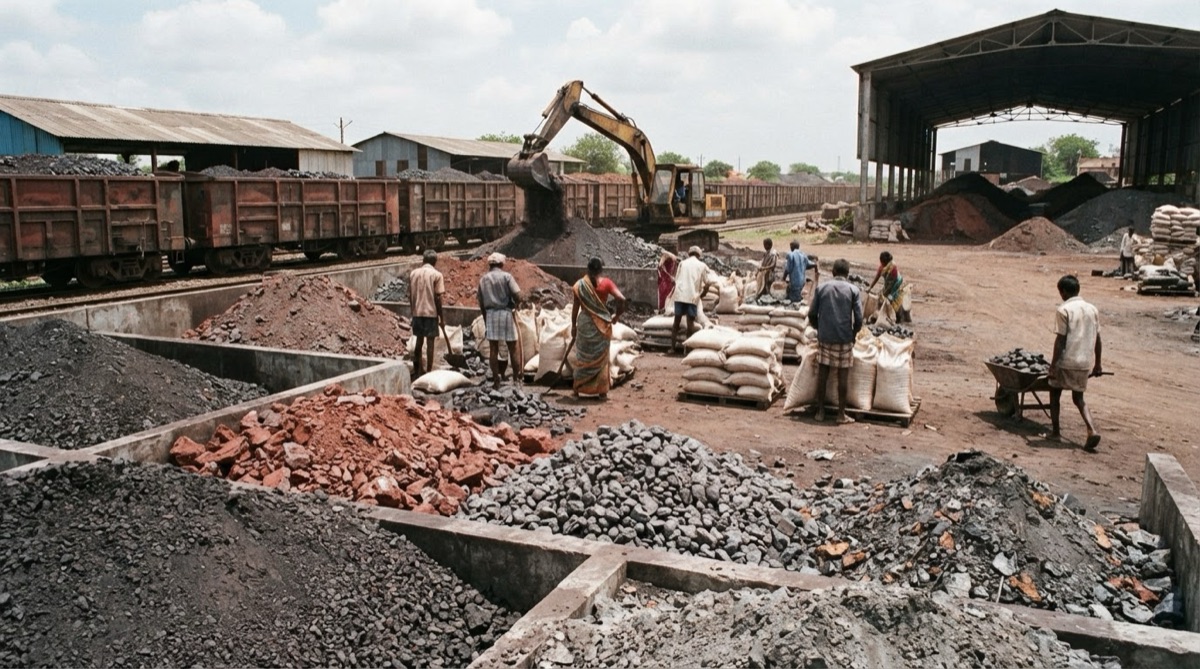
17 codes India exports2601Iron ores and concentrates, including roasted iron pyrites$1.8B in 2025 — 83% of the total2621Other slag and ash, inlcuding seaweed ash (kelp)$78M in 2025 — 4% of the total2619Slag, dross (other than granulated slag), scalings and other waste from the manufacture…$69M in 2025 — 3% of the total2614Titanium ores and concen trates$55M in 2025 — 2% of the total2607Lead ores and concentrates$49M in 2025 — 2% of the total2603Copper ores and concertrates$40M in 2025 — 2% of the total2620Slag, ash and residues (other than from the manufacture of iron or steel), containing…$21M in 2025 — under 1% of the total2606Aluminium ores and concentrates$15M in 2025 — under 1% of the total2602Manganese ores and concentrates, including ferruginous manganese ores and concentrates…$15M in 2025 — under 1% of the total2618Granulated slag (slag sand) from the manufacture of iron or steel$14M in 2025 — under 1% of the total2613Molybdenum ores and concentrates$12M in 2025 — under 1% of the total2617Other ores and concentrates$1.7M in 2025 — under 1% of the total2610Chromium ores and concentrates$880K in 2025 — under 1% of the total2615Niobium, tantalum, vanadium or zirconium ores and concentrates$110K in 2024 — under 1% of the total2604Nickel ores and concentrates$60K in 2025 — under 1% of the total2608Zinc ores and concentrates$30K in 2025 — under 1% of the total2612Uranium or thorium ores and concentrates$20K in 2024 — under 1% of the total